The best way to understand why your product is used.
You probably have a very good idea of how your product is used. Vespucci explains why it's used.
Bring your existing data
No time-consuming setup, no new tagging plans. You can simply connect Vespucci to your existing Amplitude or Segment integrations and extract more value from the data you're already collecting.

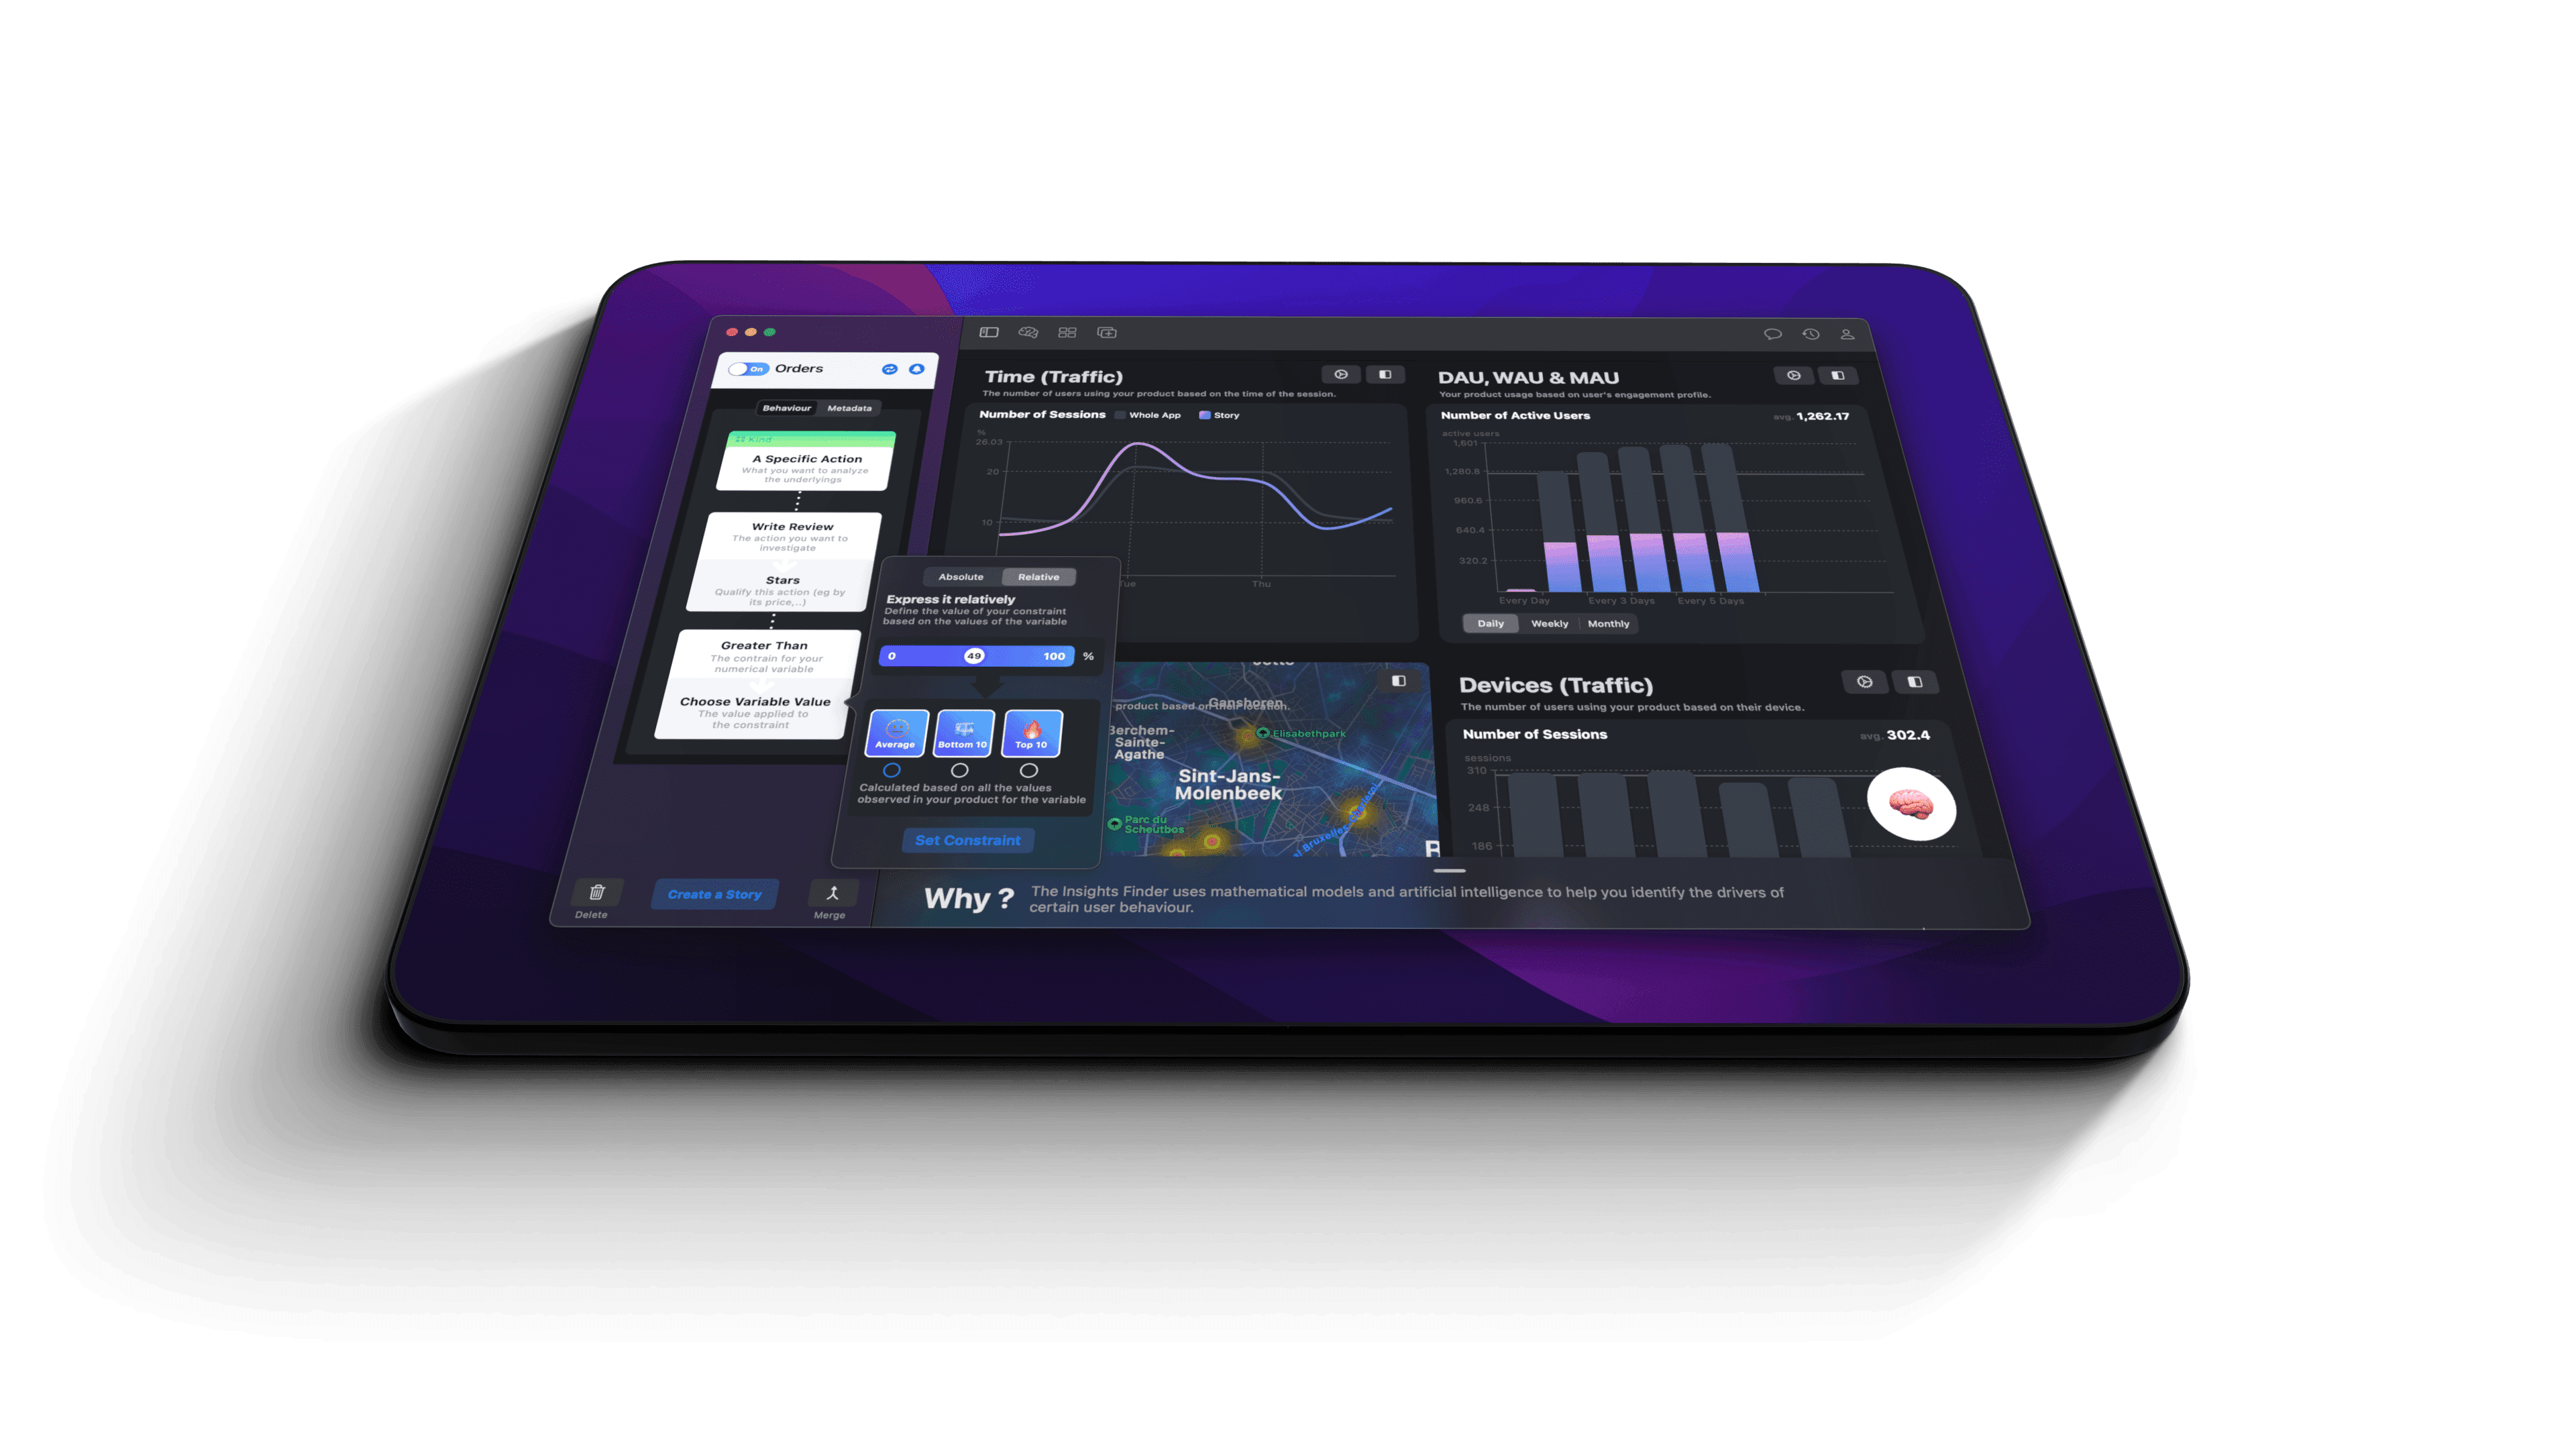
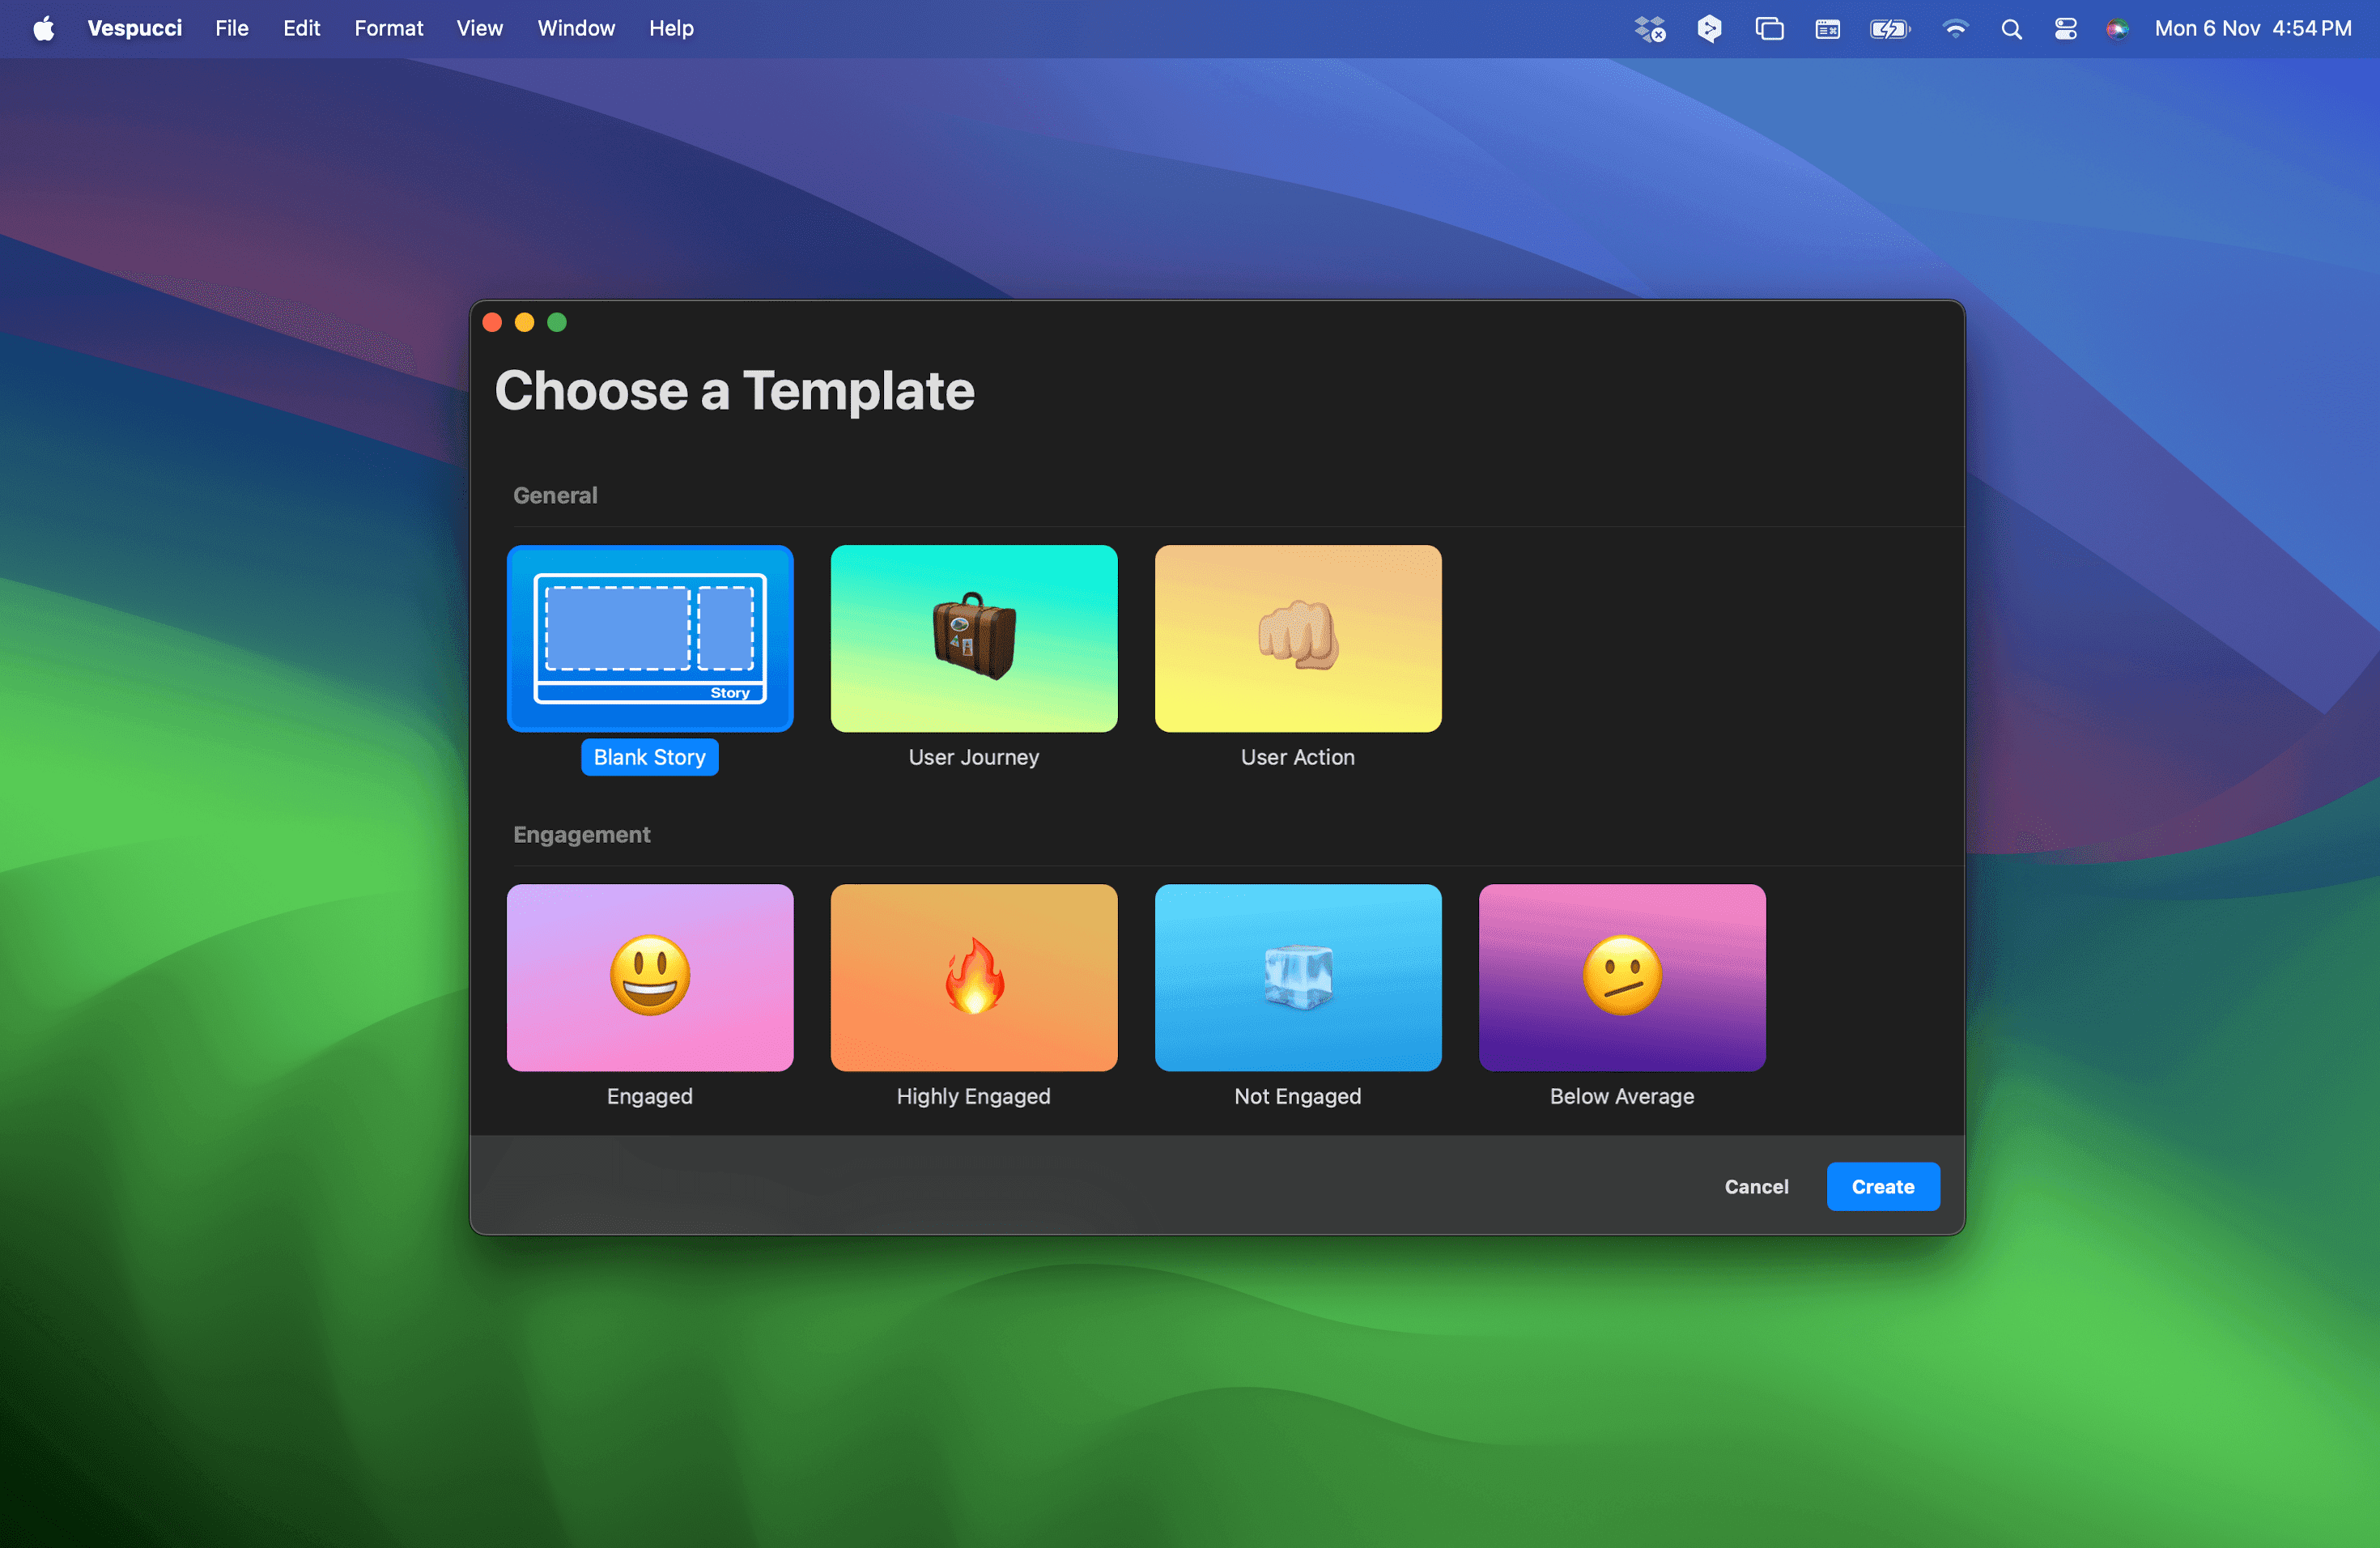
Ask our models any product questions
Describe a metric or a behaviour that you can't quite figure out. Our visual editor lets you easily describe a wide range of issues, from user activation to retention.
We will find the insights you forgot to look for
To answer your question, our models will explore your data from top to bottom, including the socio-demographic characteristics of your users, the actions they've taken in the past, the content of your UX and much more. At the end of this exploration, Vespucci will provide you with a report identifying the elements that are likely to increase (or decrease) the probability of what you've outlined in your question.
We'll let you know if the answer changes
Your product is dynamic, you will deploy updates that may break things, explore new markets where users act differently.... For all this, we run our models on remote servers 24/24 and notify you if anything happens.
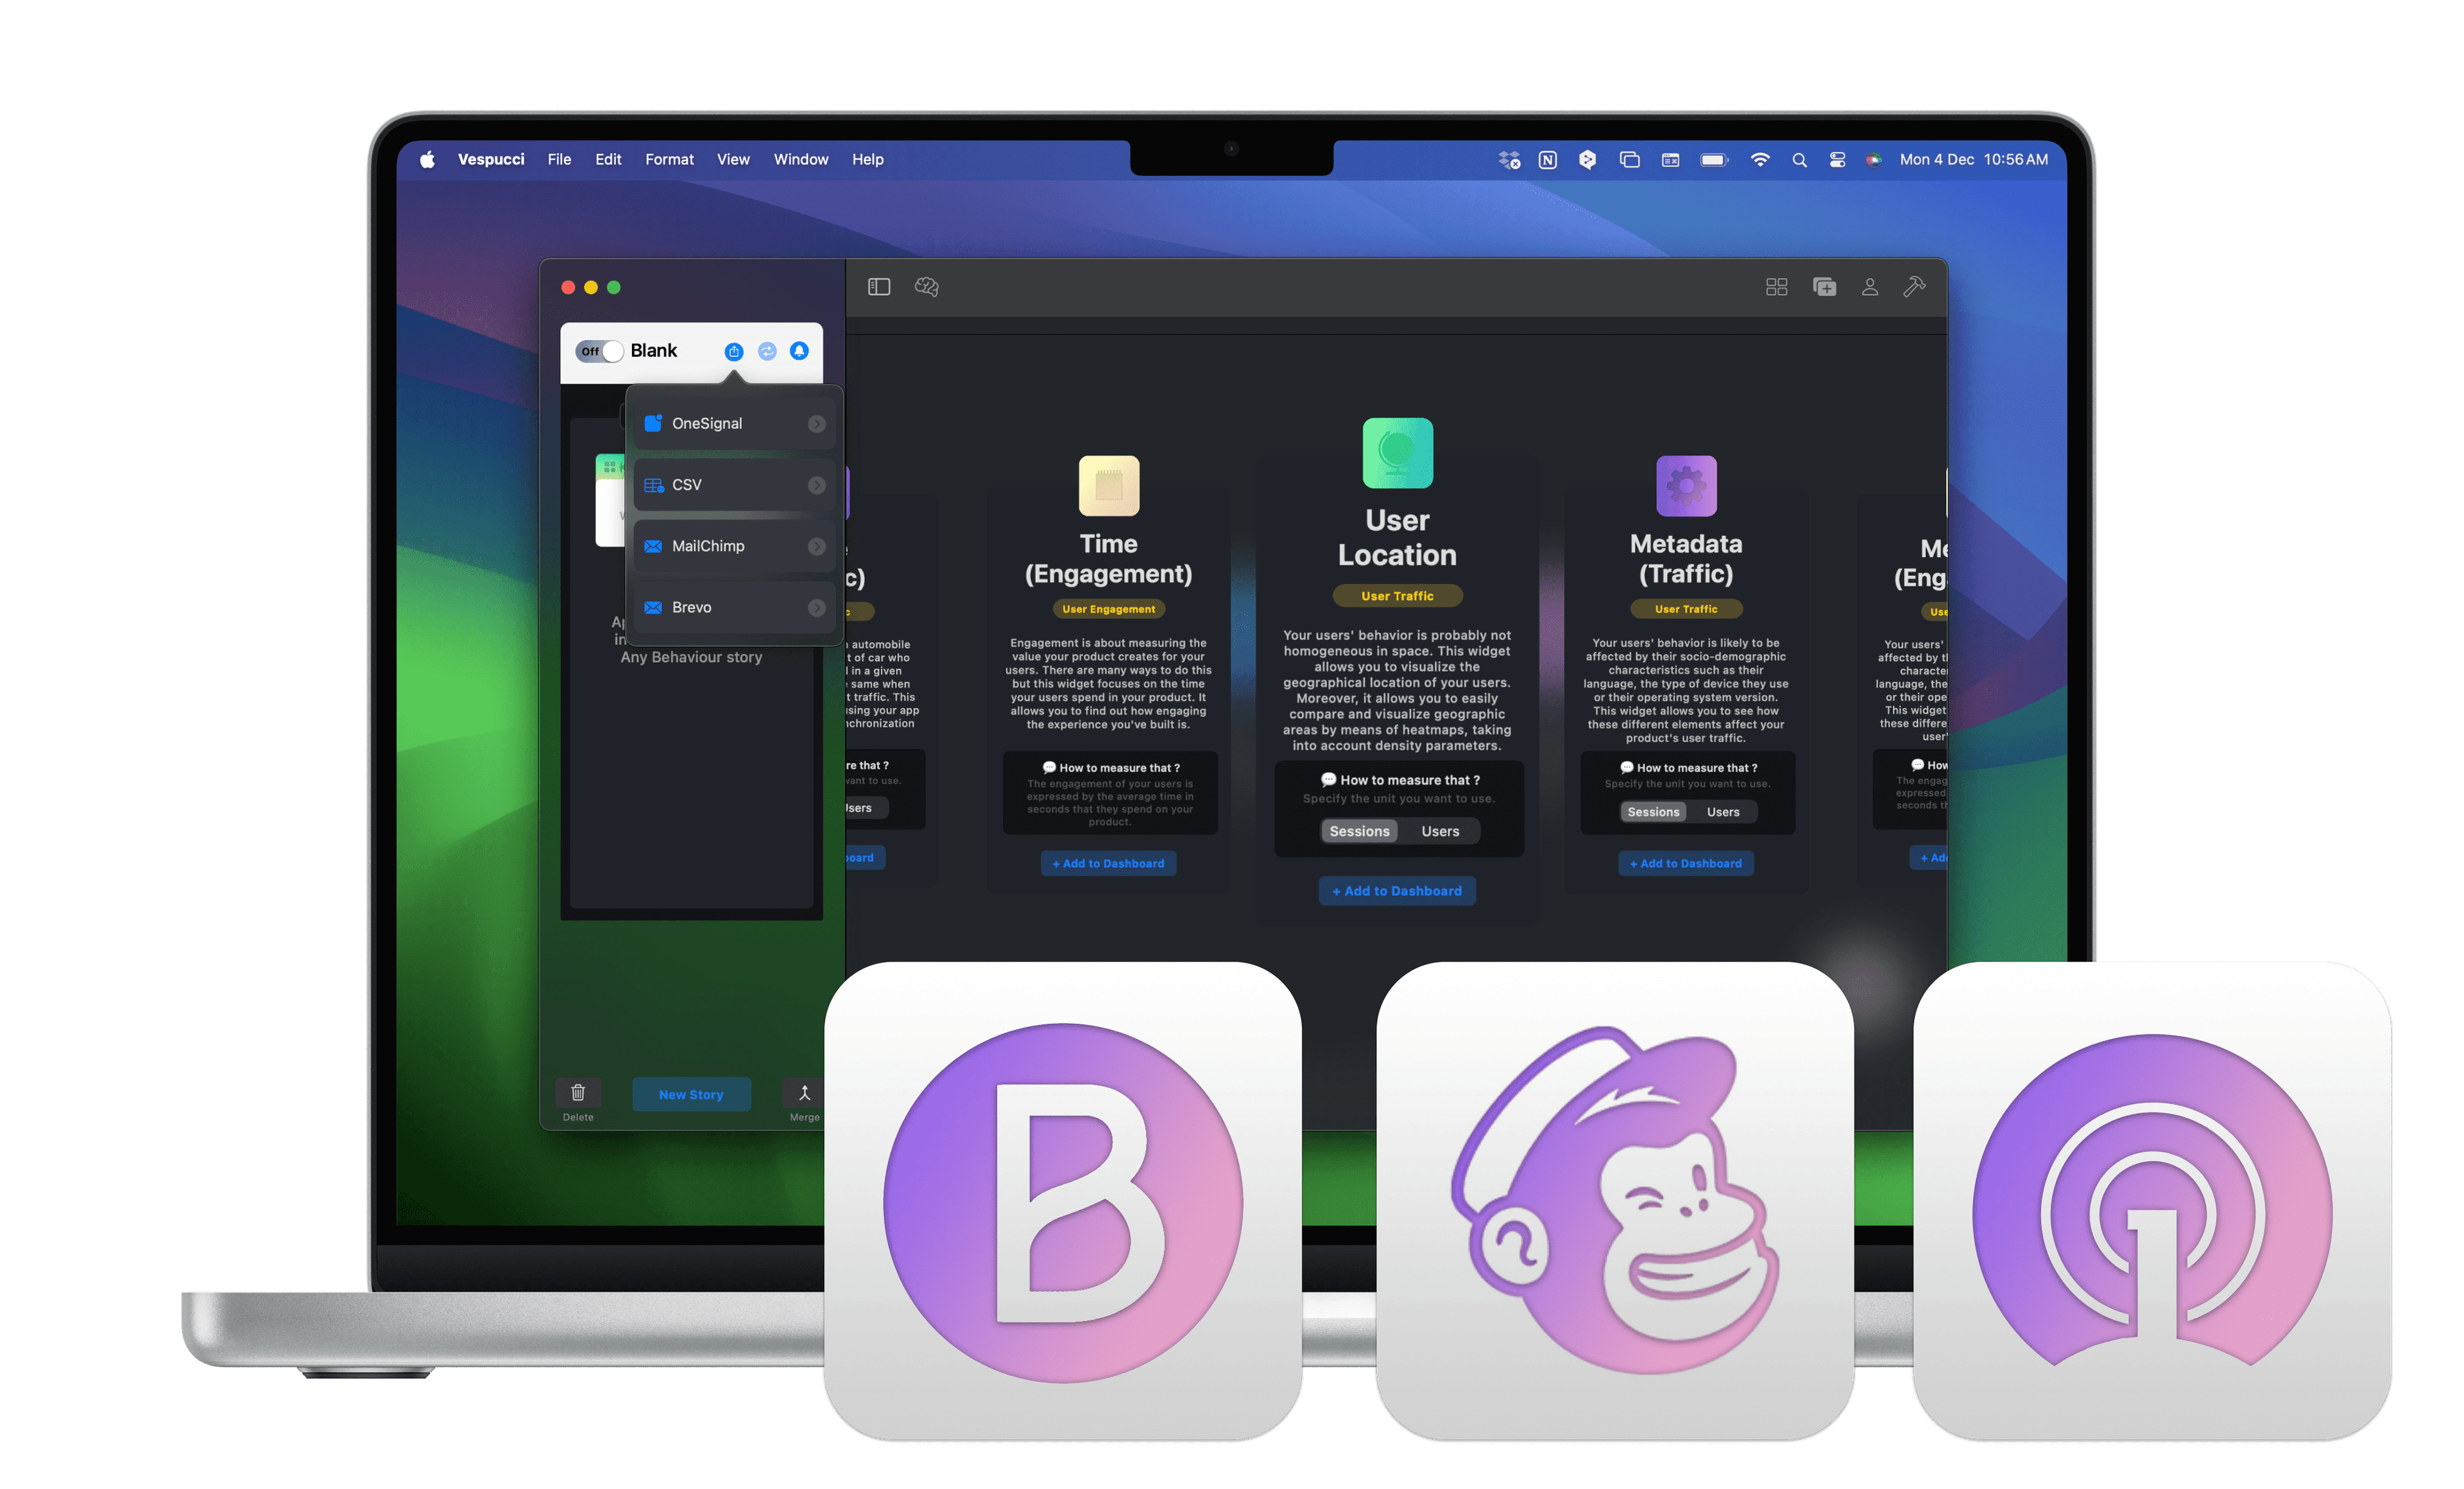
Turn these insights into value
Once you've identified a remarkable user segment, you can activate it with your traditional retargeting tools. For example, you can send a push notification via One Signal to users who have left a negative review of your product and haven't come back since to apologize. While you can connect your favorite mailing tools (MailChimp, Brevo) to sharpen the segmentation of your e-mail campaigns.
Data Science as a Service
It is super fast to integrate Vespucci. If you are already using Segment or Amplitude, it takes less than 10 minutes. Create an account today to join the waiting list.